 Staircase AI
Turning customer conversations into actionable intelligence.
Staircase AI transforms emails, meetings, and support interactions into insights about customer relationships, risks, and growth opportunities.
As the sole Product Designer, I designed the product experience from the ground up, working closely with the founders and cross-functional teams to turn customer needs and complex AI-driven data into intuitive workflows that help Customer Success teams understand where to focus, why it matters, and what to do next.
The problem
The data was all there. The story behind each account wasn't.
Customer Success Managers (CSMs) were responsible for dozens of accounts, but understanding the health of each relationship meant piecing together information scattered across emails, meetings, support tickets, and CRM systems.
Traditional metrics could show activity, but not necessarily the quality of a relationship. A busy account could still have frustrated stakeholders, while declining communication with a key decision-maker might go unnoticed.
Without a clear view of these signals and the people behind them, teams struggled to know which accounts needed attention, why, and where to act before risks escalated.
Research & Insights
Four insights that shaped the product.
Before designing the product, we spoke with Customer Success professionals, team leads, and managers to understand their daily challenges, how they monitored customer relationships, and where existing workflows fell short.
These conversations helped us identify the problems worth solving and shape the initial solutions. As we designed and developed each experience, we brought it back to customers, gathered feedback, and refined the approach based on what worked and what still needed improvement.
- 01Priorities before detailsManaging dozens of accounts made it difficult to know where to start. CSMs needed a way to identify which customers required attention before diving into individual account data.
- 02Relationships behind the metricsActivity numbers alone couldn't reveal the strength of a customer relationship. Understanding who was involved, their influence, and the quality of communication was essential.
- 03Important signals were easy to missChanges in engagement, sentiment, or responsiveness could be buried across conversations and systems, making emerging risks difficult to recognize.
- 04From overview to evidenceTeams needed both a clear portfolio-level overview and a way to investigate the people, activities, and conversations behind each signal, without losing context.
Design approach
From scattered signals to informed decisions.
The challenge wasn't simply to display more customer data. It was to make complex, AI-generated insights understandable, relevant, and actionable.
Three principles guided the experience:
- 01Surface what mattersBring potential risks, opportunities, and meaningful changes to the forefront, helping CSMs prioritize without scanning every account.
- 02Keep the context connectedConnect account health, stakeholder relationships, and communication history so users can move from an overview to the evidence behind each signal.
- 03Make AI insights interpretablePresent AI-generated signals alongside the underlying context, allowing users to investigate findings and apply their own judgment rather than relying on an unexplained score.
Together, these principles shaped a flexible workflow: identify what needs attention, understand the relationships involved, investigate the underlying signals, and decide what action to take.
- SignalsEmails, meetings, tickets, CRM
- 01PrioritizeWho needs attention today?
- 02UnderstandWho is involved, and how do they feel?
- 03InvestigateWhat changed, when, and why?
- ActReach out with the full context
Customer Health Overview
Making account prioritization visible.
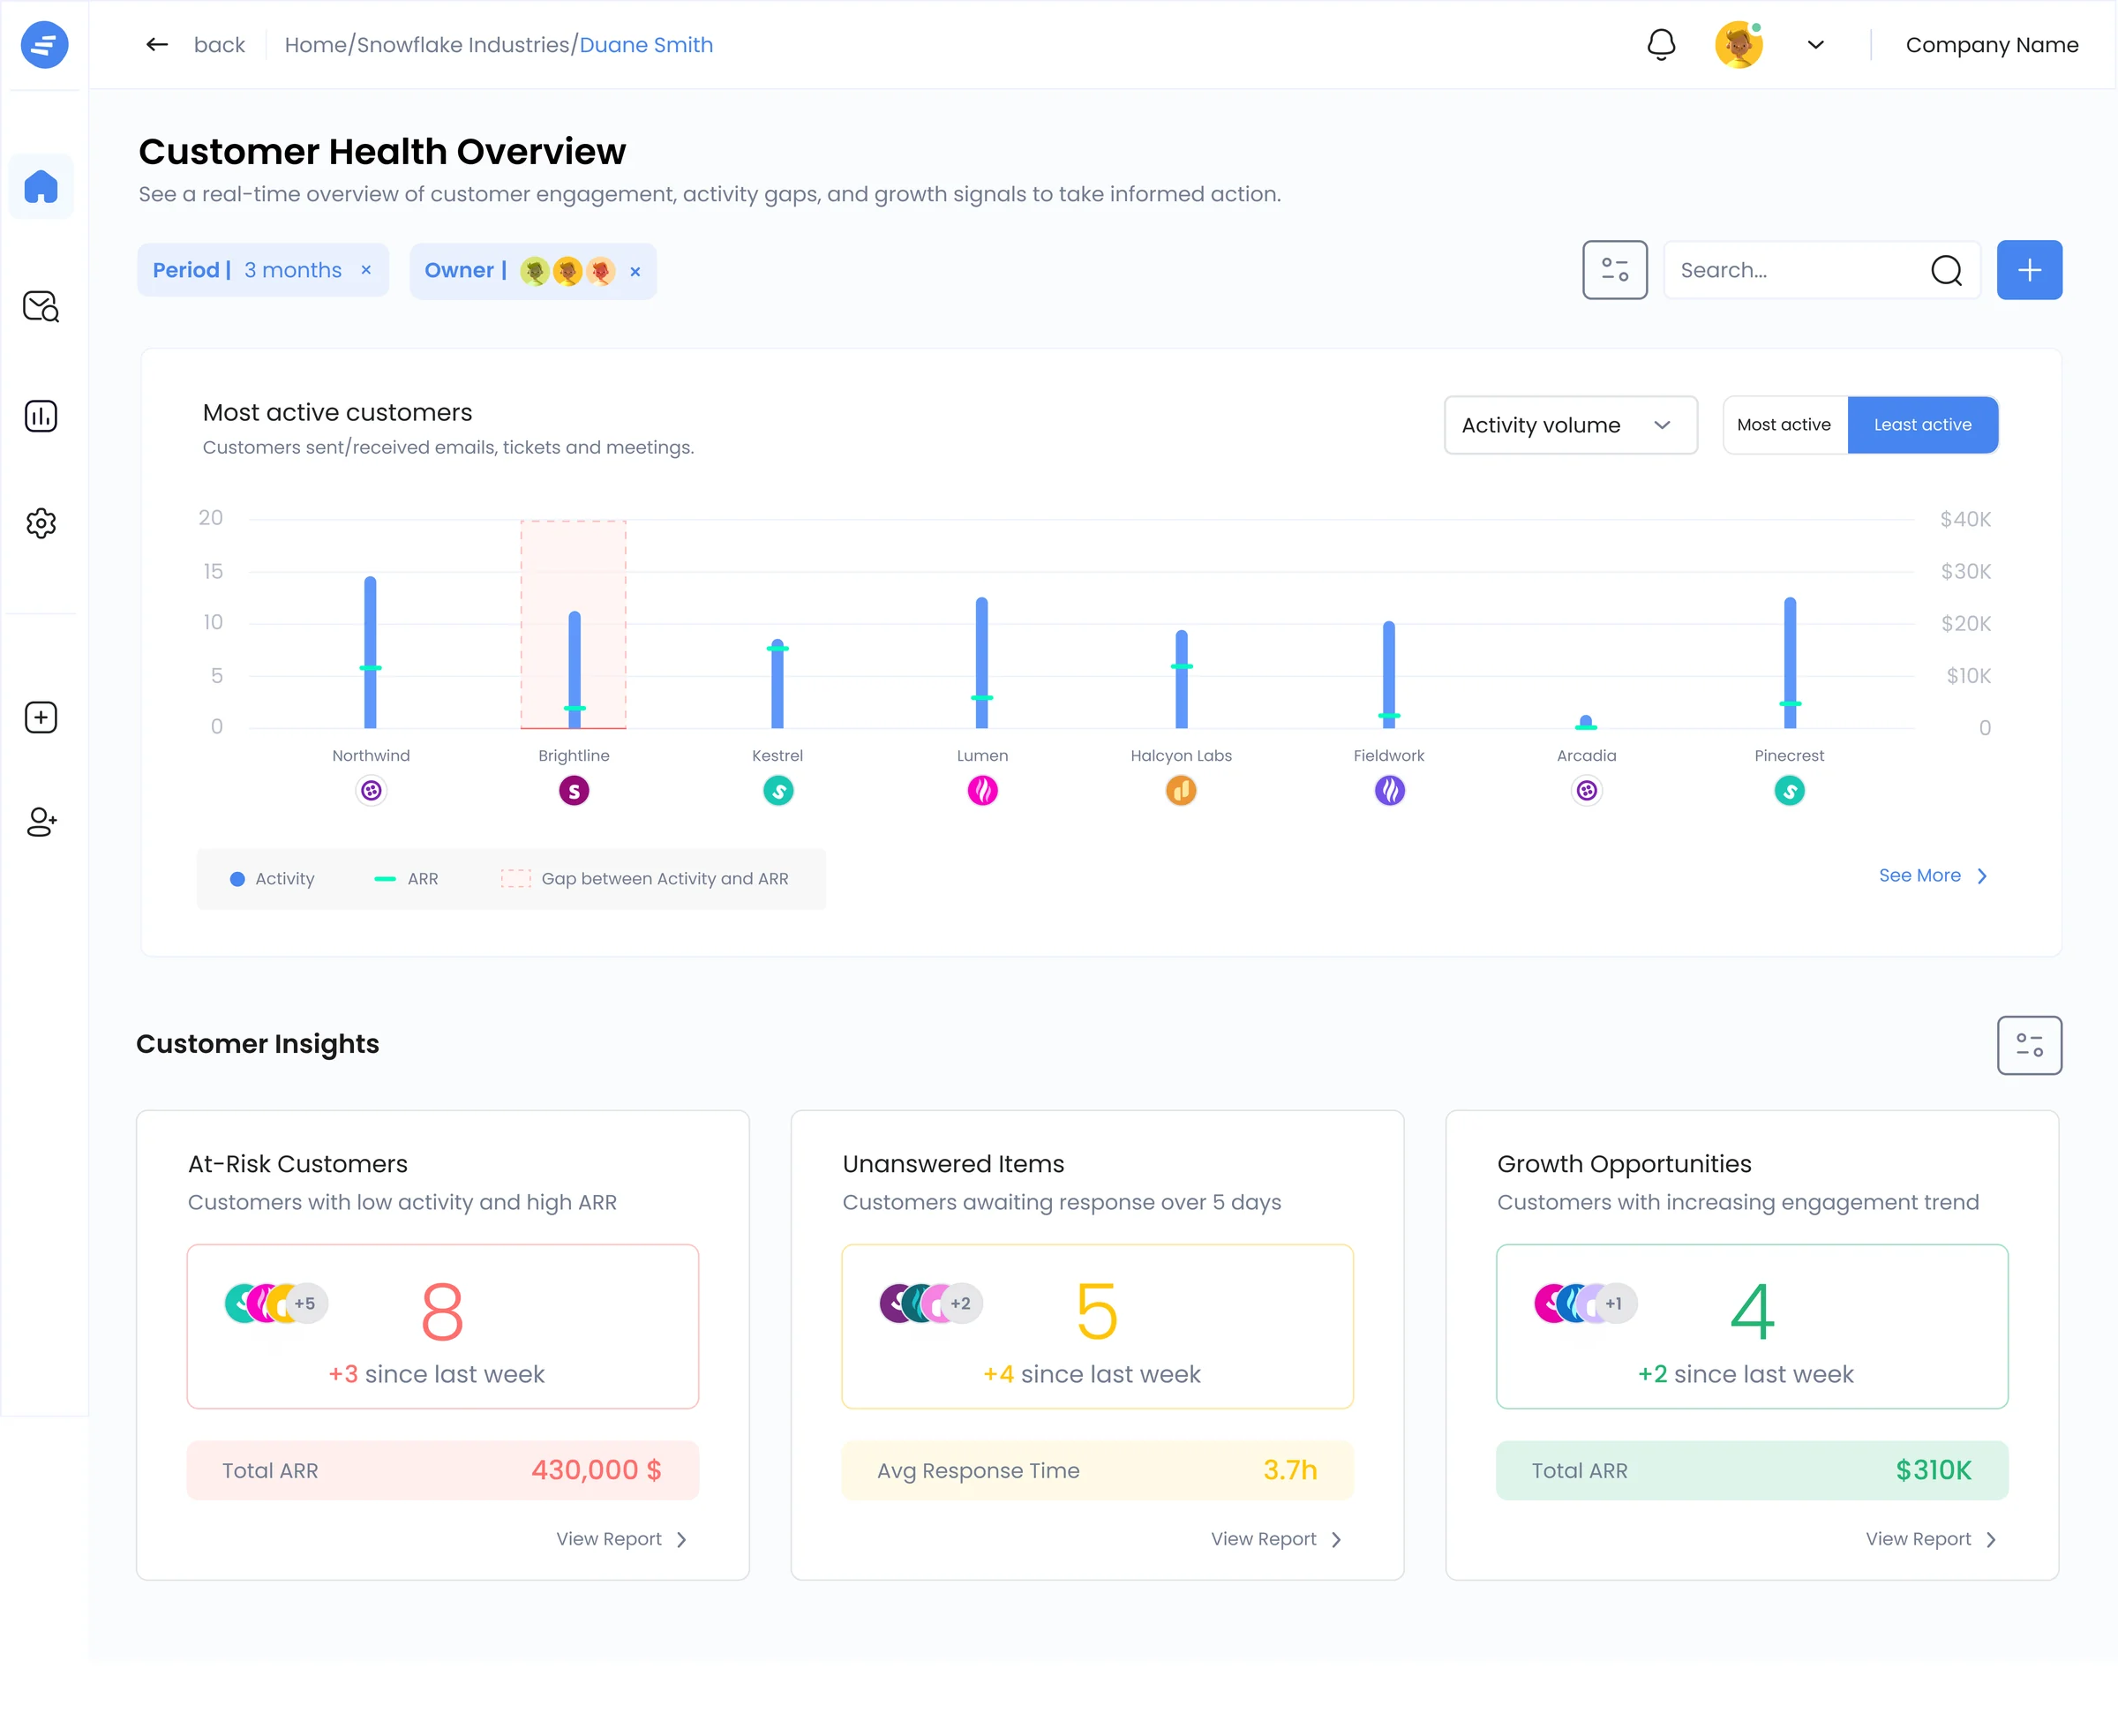
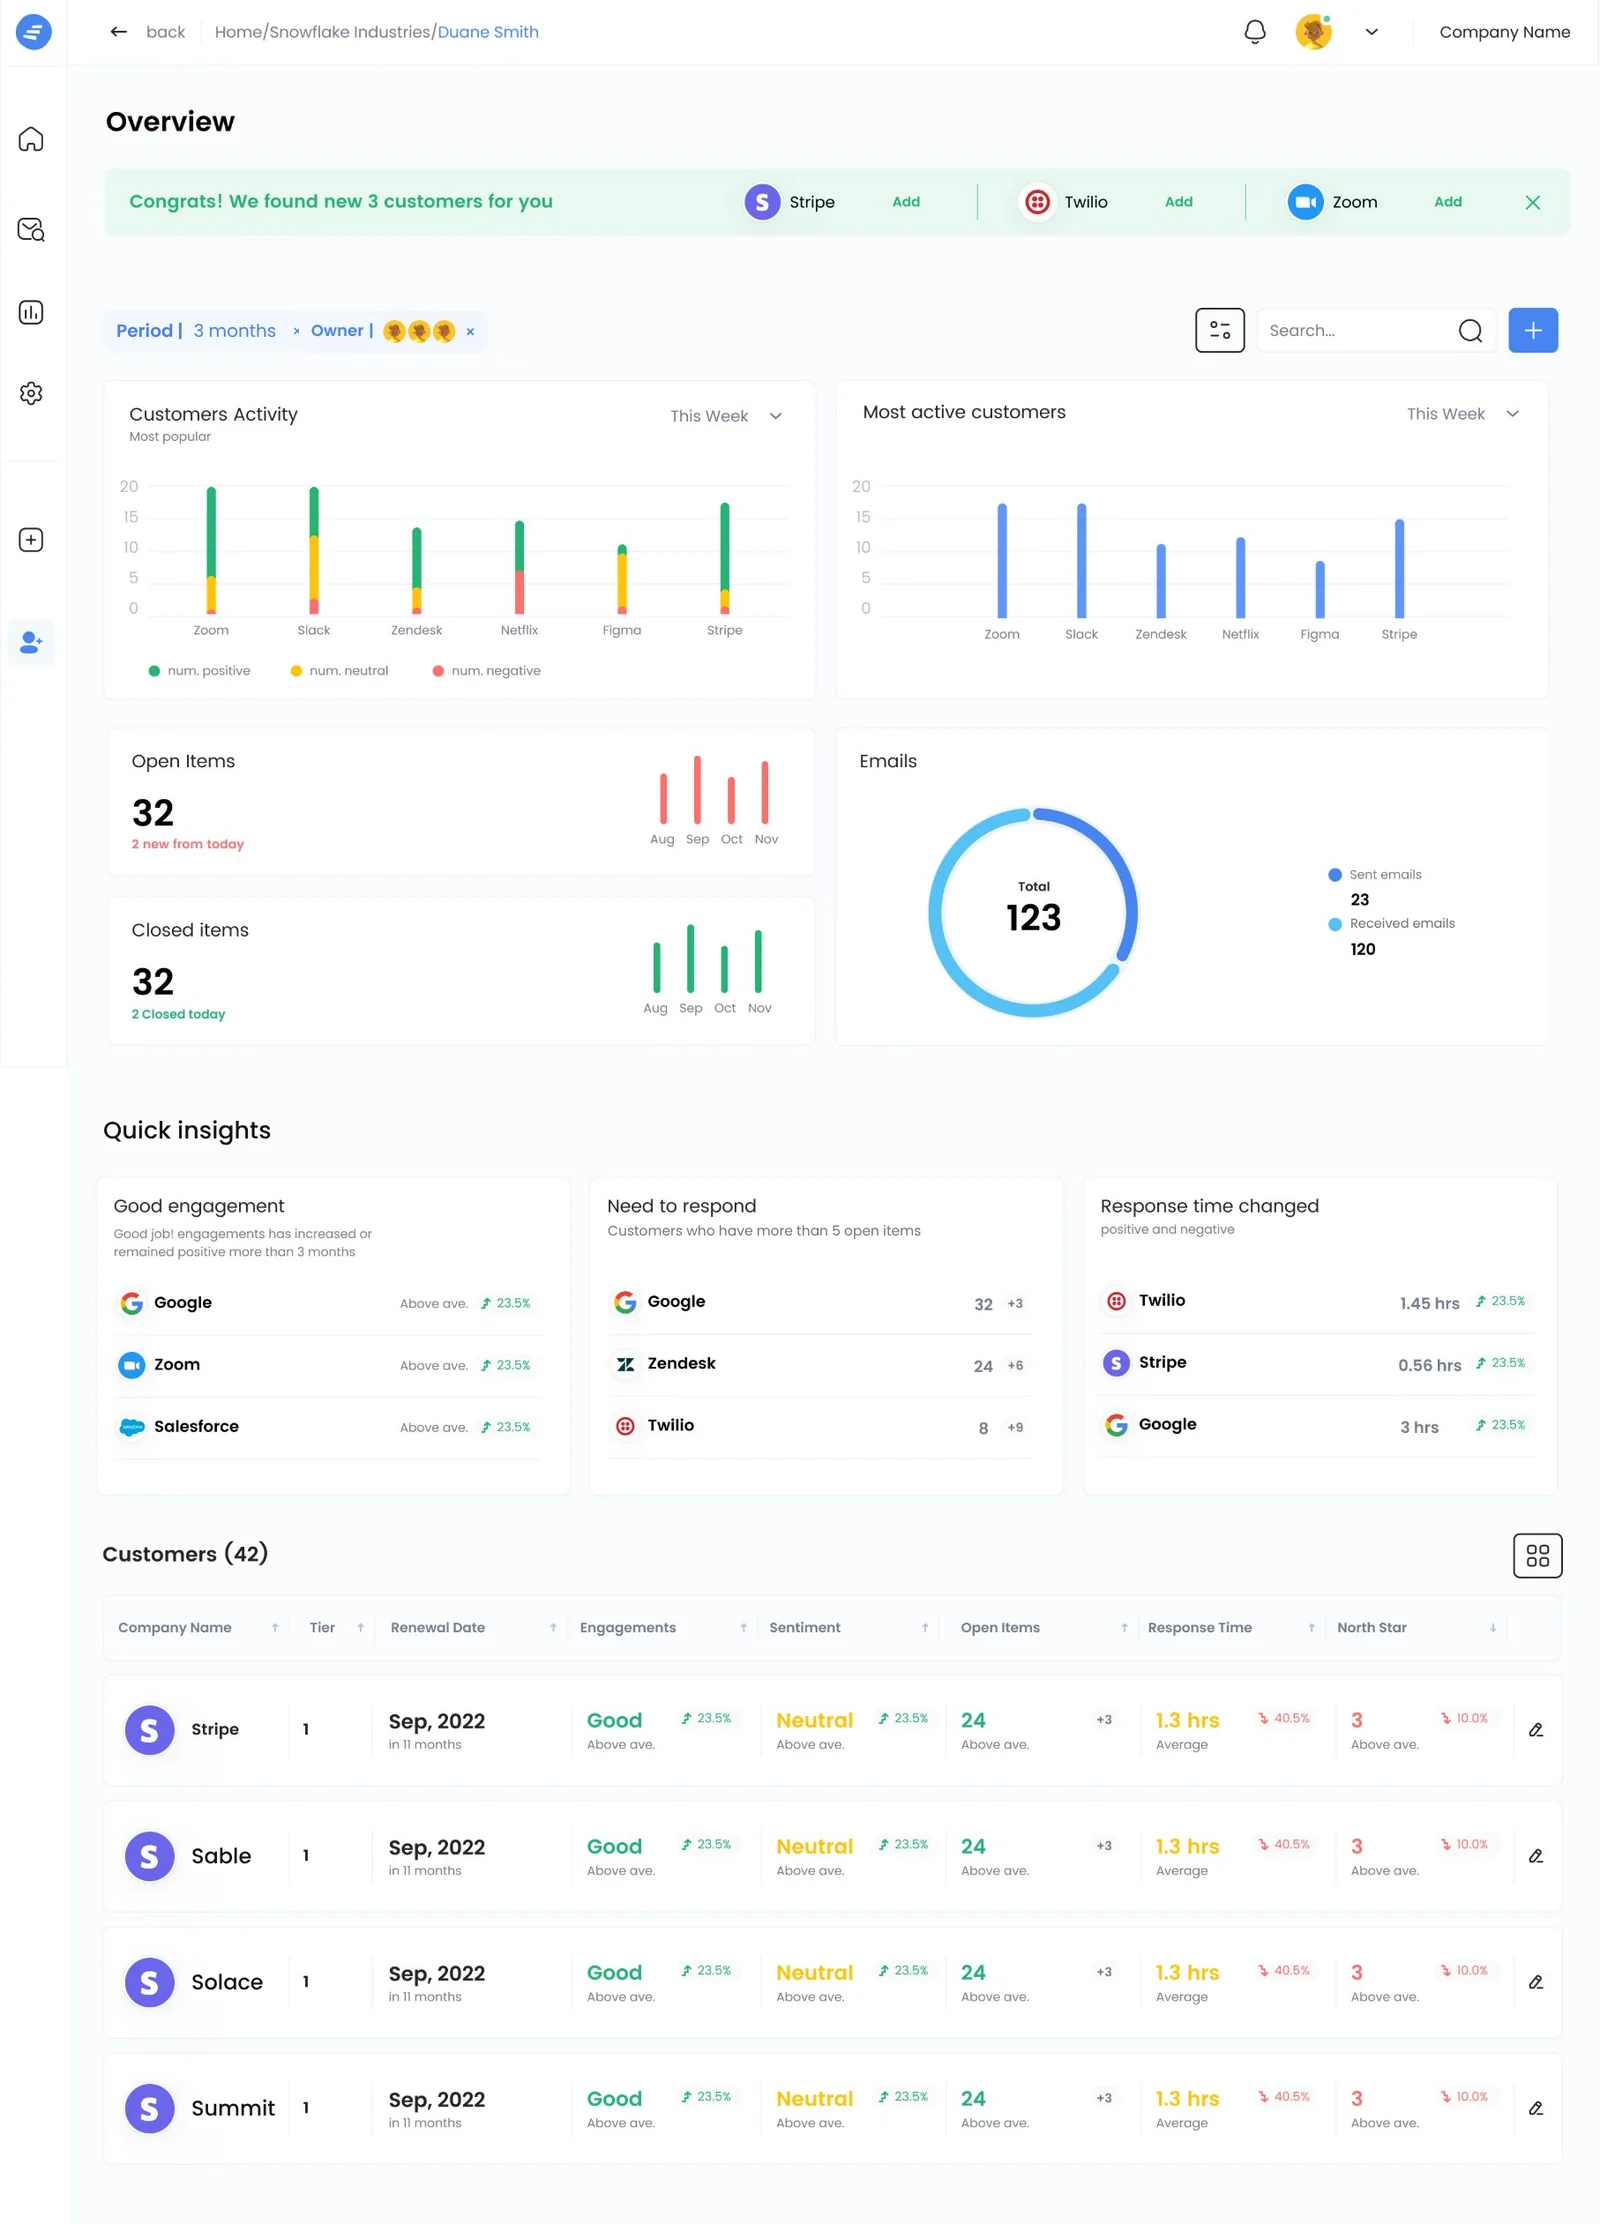
CSMs needed to identify which customers required attention without reviewing every account individually. I designed a portfolio-level overview that brings customer activity, business value, and potential risks into one place, helping teams decide where to investigate first.
 1234
- 1Focus on the right accountsOwner and date filters let CSMs narrow the overview to their accounts and the period they need to evaluate.
- 2Reveal the gap between activity and valuePlacing activity bars alongside revenue markers makes it easier to spot high-value accounts with unexpectedly low engagement, bringing potential blind spots into focus.
- 3Look beyond the most active customersA toggle lets users switch between the most and least active accounts, revealing quieter relationships that might otherwise be overlooked.
- 4Turn signals into starting pointsSummary cards highlight accounts at risk, unanswered communications, and growth opportunities, combining account counts, changes over time, and revenue context with access to more detailed reports.
Stakeholder Relationship Map
Understanding the people behind account health.
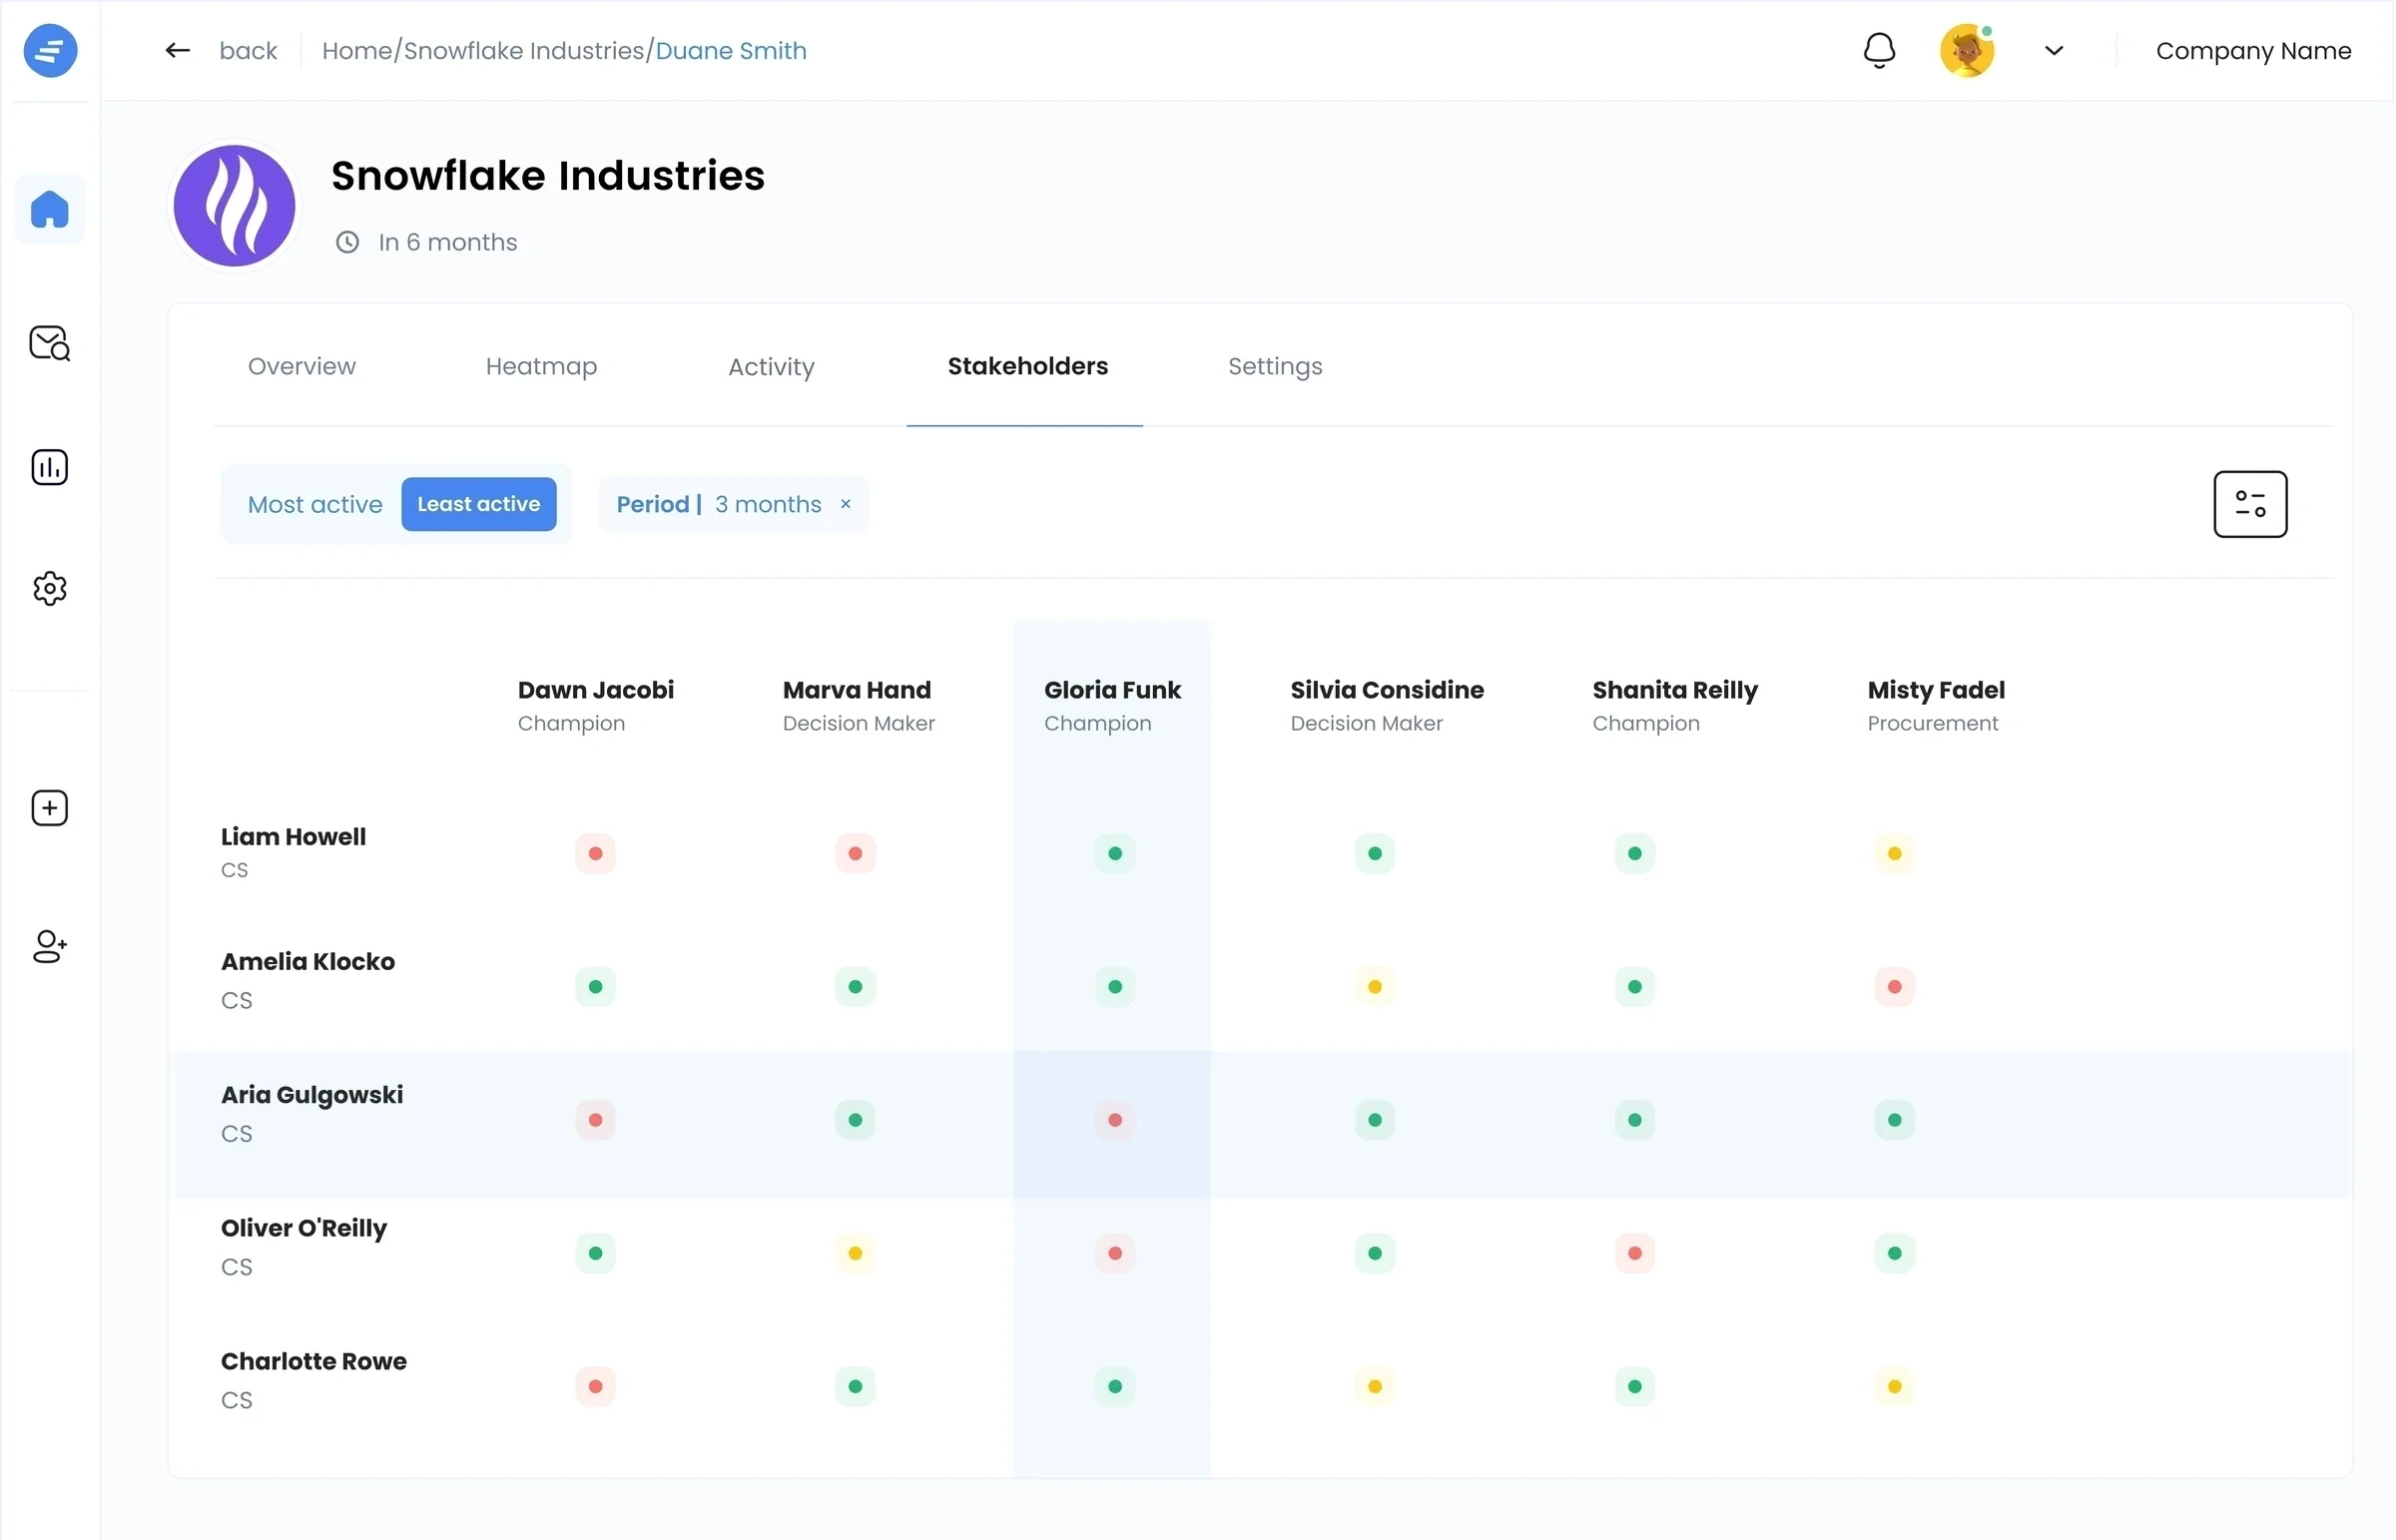
Account-level metrics could reveal changes in engagement, but not which relationships were driving them. I designed a visual relationship map to help CSMs understand the people within each customer organization, their connections, and the strength of communication around them.
- 01Make relationships visibleRepresent stakeholders and their connections visually, turning a complex network of people into a structure that CSMs can explore and understand.
- 02Add relationship contextBring communication and sentiment signals into the map, helping users look beyond job titles and organizational structure to understand the quality of individual relationships.
- 03Reveal potential blind spotsMake it easier to notice key stakeholders with limited engagement or weakening communication, even when overall account activity appears healthy.
- 04Support more informed outreachHelp CSMs identify relationships worth investigating or strengthening, using the map as a starting point for more targeted engagement rather than relying on assumptions about account health.
Activity Timeline & Communication Summary
Connecting the signals to the conversations behind them.
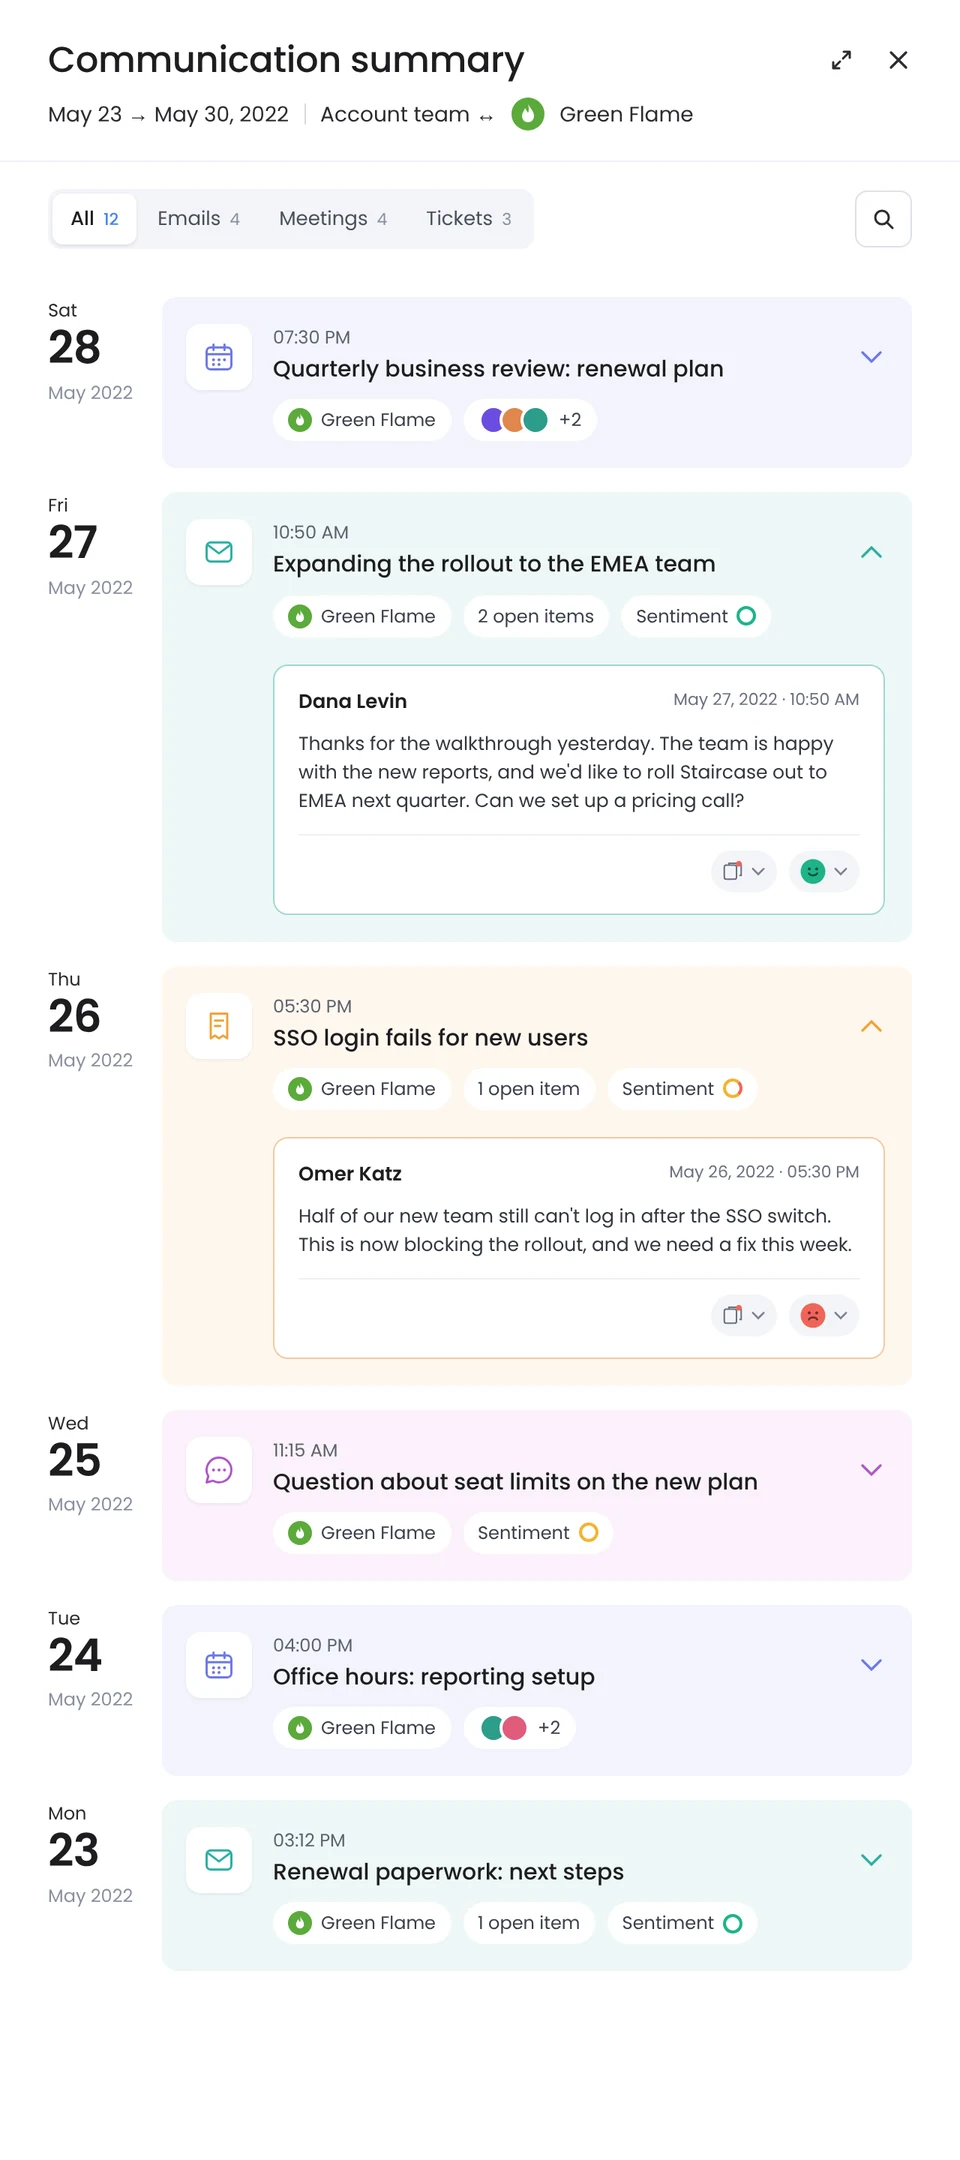
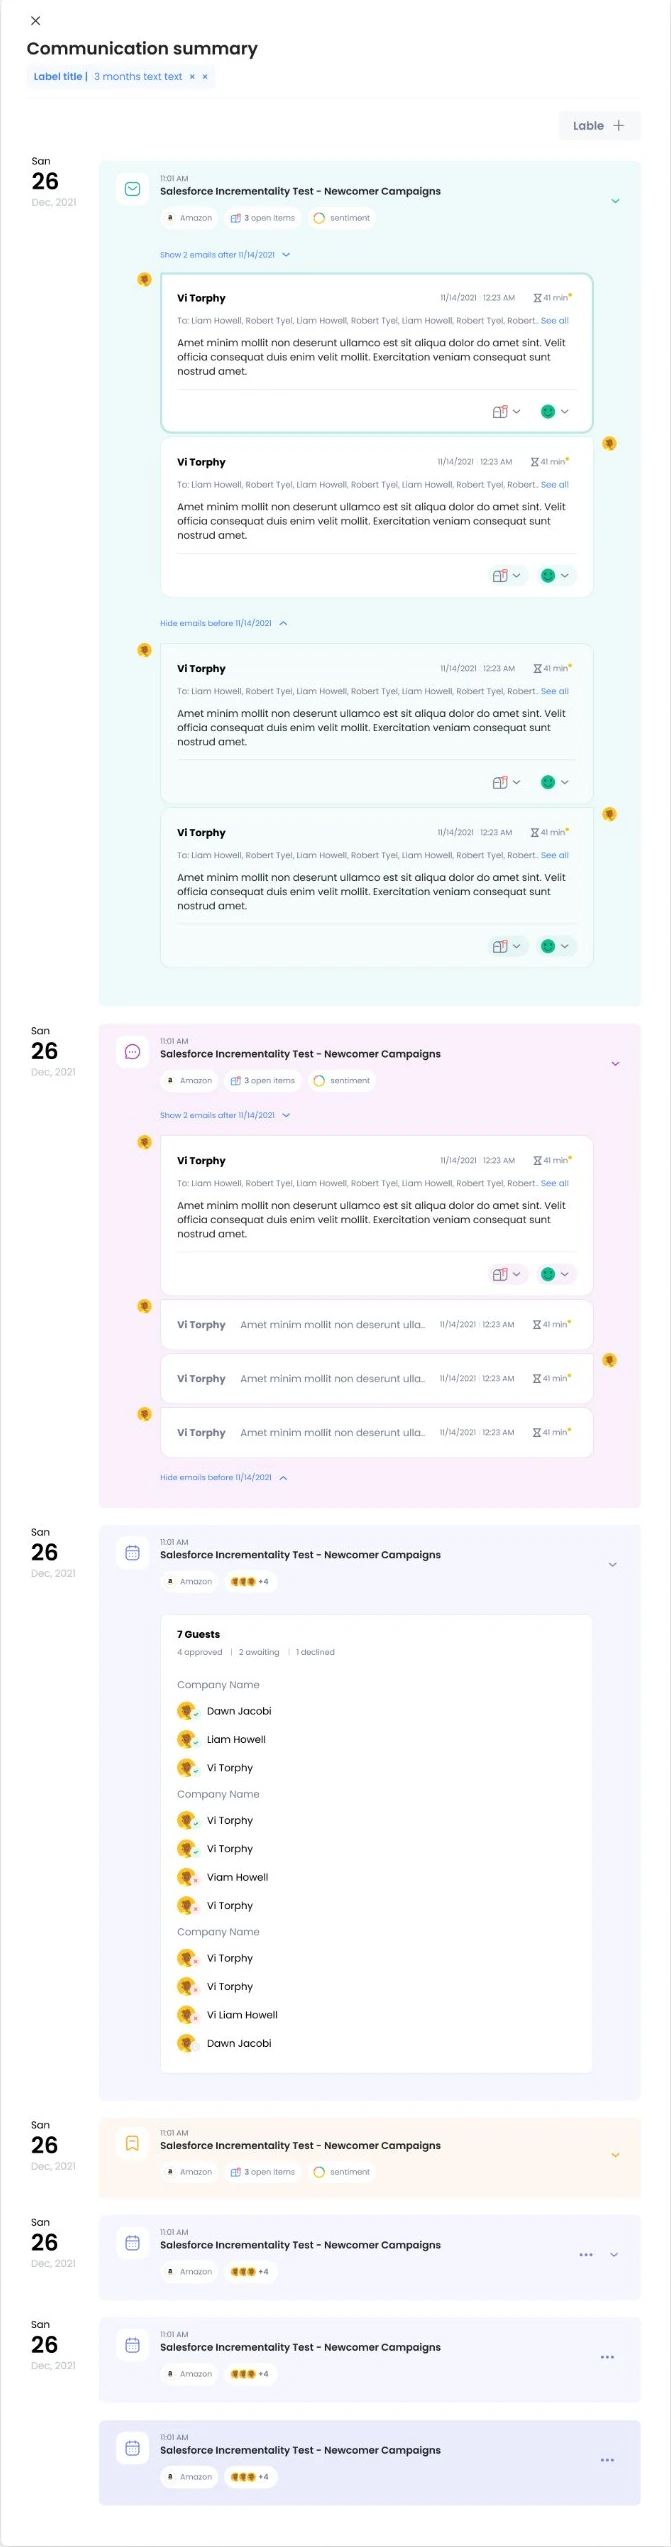
Activity trends could indicate that something had changed, but not explain what happened or why. I designed an investigative view that connects customer activity over time with the underlying communication, helping CSMs explore patterns, understand context, and make more informed decisions.
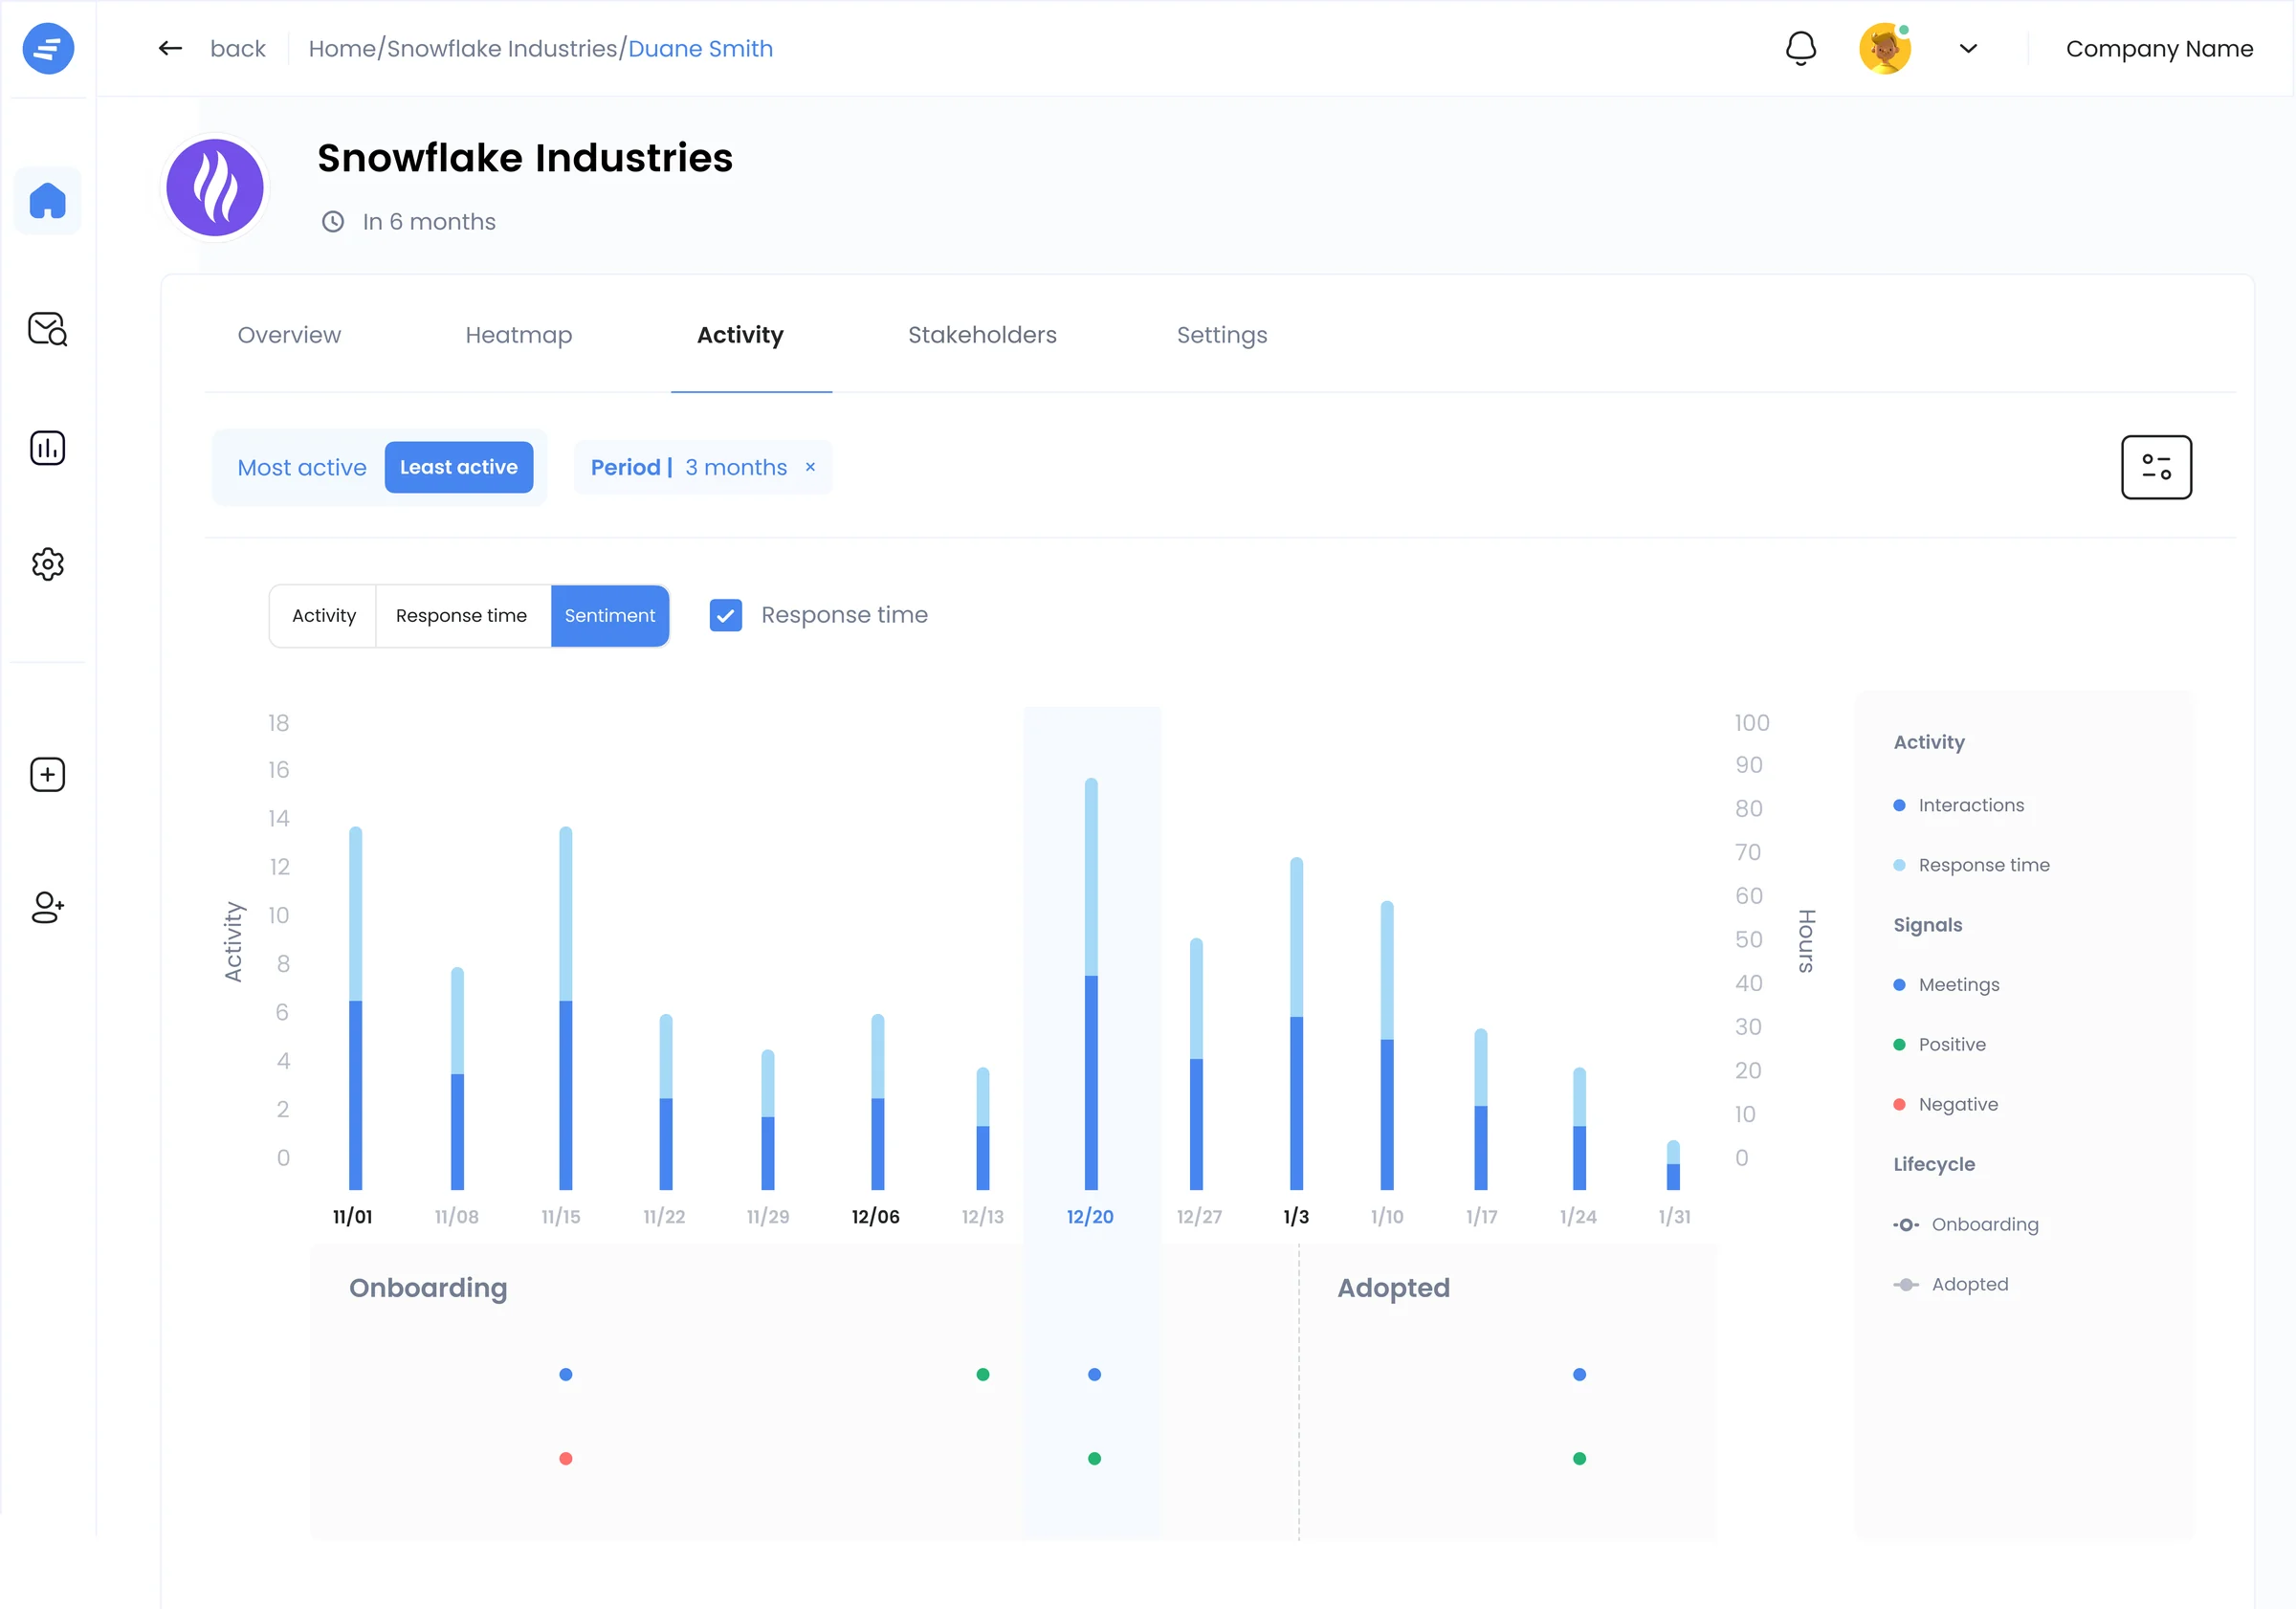
- 01See how engagement evolvesA timeline visualizes changes in customer activity over time, helping CSMs recognize shifts, gaps, and unusual patterns rather than relying on isolated data points.
- 02Investigate without losing contextDisplaying communication alongside the activity chart allows users to connect changes in engagement with the emails, meetings, and interactions behind them, without constantly switching between views.
- 03Turn conversations into readable insightsAI-generated summaries and sentiment indicators help users review large volumes of communication more efficiently, while keeping the underlying interactions accessible for closer investigation.
- 04Keep human judgment in controlUsers can correct sentiment classifications when the AI misinterprets a conversation. This gives CSMs a way to challenge the system's interpretation instead of treating AI-generated insights as unquestionable facts.
Outcome & my contribution
From fragmented information to connected customer intelligence.
Staircase AI was built from the ground up to help Customer Success teams move beyond isolated metrics and better understand the relationships, conversations, and emerging signals behind each account.
The resulting experience brought together account prioritization, stakeholder relationships, and communication analysis into connected workflows, giving CSMs a clearer way to identify where attention might be needed and investigate why.
As the sole Product Designer, I was responsible for shaping the end-to-end user experience, translating customer needs into product workflows, designing complex data-rich interfaces, and iterating on solutions through ongoing customer feedback.
Rather than treating AI insights as final answers, the experience was designed to make them accessible, explorable, and open to human judgment.
Reflection
Designing for understanding, not just prediction.
One of the most important lessons from Staircase AI was that identifying a potential risk is only part of the experience. Users also need to understand the signals behind it, explore the context, and decide whether the insight calls for action.
Designing the product from the ground up reinforced the importance of connecting AI-driven analysis with human judgment, especially when decisions depend on complex relationships rather than isolated metrics.

Better customer decisions start with understanding the relationships behind the data.